
Summation
Section titled “Summation”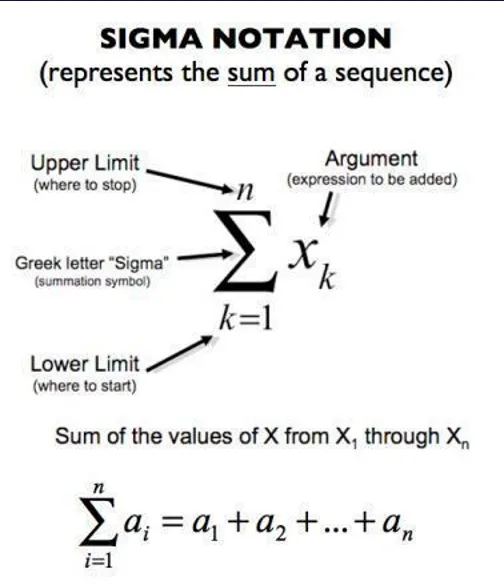
Descriptive statistics with code in Python
Section titled “Descriptive statistics with code in Python”- Divide into
- Measures of central tendency
- Answers “What does the middle of our data look like?”
- Mean
- Median
- Mode
- Answers “What does the middle of our data look like?”
- Measures of spread
- Answers “How much does my data vary?”
- Range and interquartile range
- Standard deviation
- Variance
- Answers “How much does my data vary?”
- Measures of central tendency
- Average value of a data set
- Sum of all values divided by the number of observations
Median
Section titled “Median”- Define a typical value in the data set
- Does not require calculation
- Value that coincides with the middle of the data set
- Value that appears the most frequently in our data
- Intuition of the mode as the “middle” is not as immediate as mean or median, but there is a clear rationale
- Highest weighted contributing factor to our mean
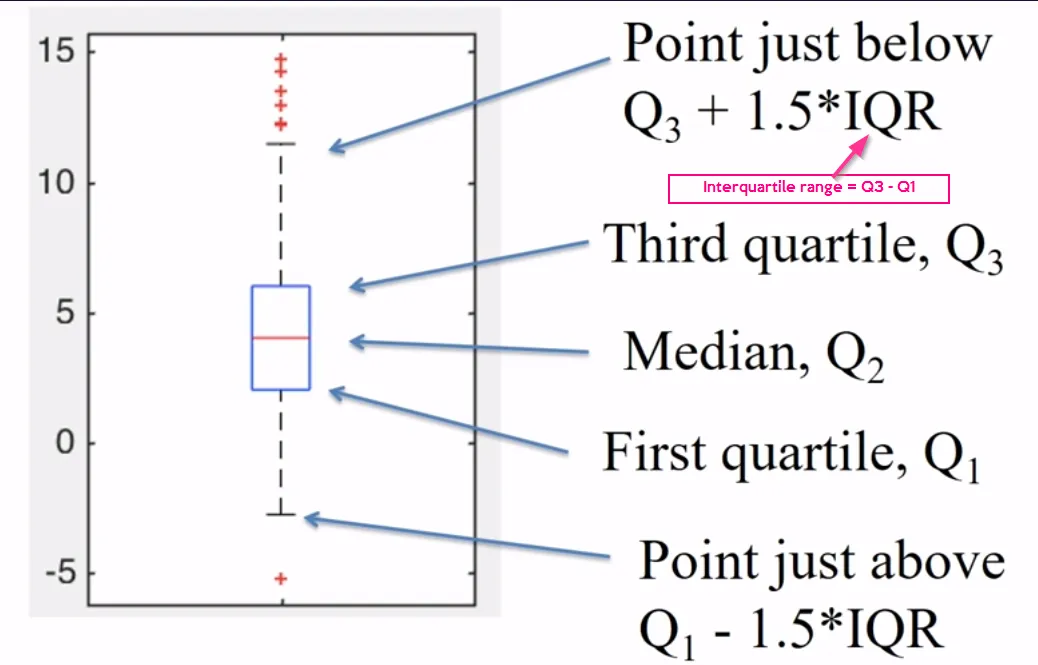
Range and interquartile range
Section titled “Range and interquartile range”- Range
- Maximum - minimum value
- Interquartile range (IQR)
- Also called the midspread or middle 50%, or technically H-spread, is a measure of statistical dispersion, being equal to the difference between 75th and 25th percentiles, or between upper and lower quartiles, IQR = Q3 − Q1

Standard deviation
Section titled “Standard deviation”- Measure of the spread of your observations
- Statement of “how much your data deviates from a typical data point”
- Summarizes how much your data differs from the mean

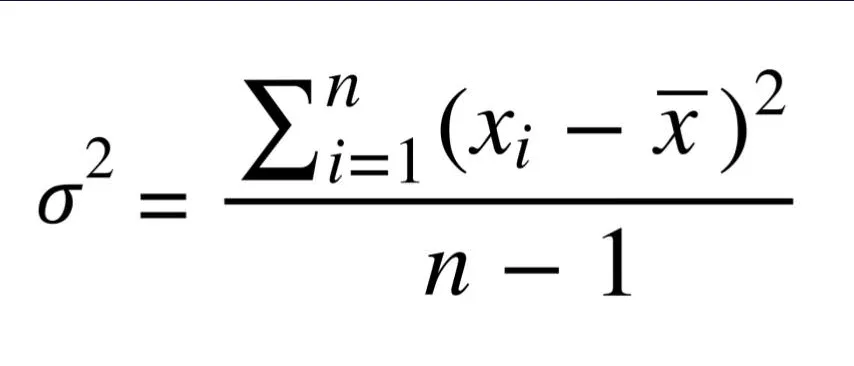
Variance
Section titled “Variance”- Square of the standard deviation, for the reason of:
- Avoiding negative values in the sum
- Pointing out the significance of outliers
- Having an exponential term that allows us to find where the point of minimum deviation is
- Usually it is enough to give mean and standard deviation, but it is good to note variance as well
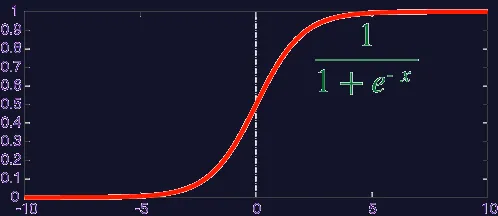
Sigmoid function
Section titled “Sigmoid function”- Classify as 1/0 (yes/no)
- Give probability, for example, “there is 65% probability of ‘yes’”
- Video
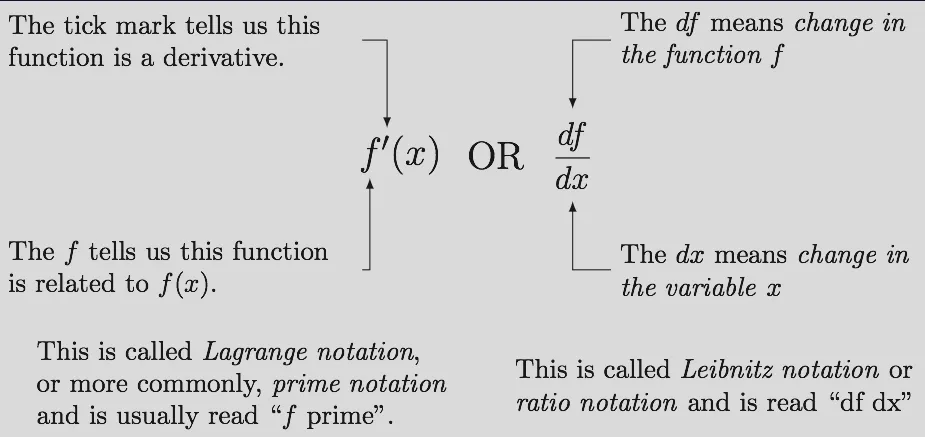
Derivative
Section titled “Derivative”- Derivative at a point ← slope of the straight line tangent to f(x) at a chosen value x
- Derivative of f(x) is
- Slope of f(x)
- Instantaneous rate of change of f(x)
- Calculating derivative
- ← typical derivative
- More examples
- Uses of derivatives
- Find minima
- Find maxima
- Find inflection points

Integral
Section titled “Integral”
- S (darker colored section) ← integral of f(x) in the interval from “a” to “b”
-

- To calculate: we need to find equation, from which derivative would equal f(x)
- Important formulas
- ← for
- because ← that is not possible
- ← can be used for
- ← for
- Examples:
-
- because
- C = any constant
- ← it’s enough to type one C
-
- imagine that ← but it’s not normal to think like that
-